
Introduction
Granular material (sand) subjected to cyclic loading is characterized by the change of shear modulus, pore water pressure, and volume. The change occurs when the amplitude of the cyclic shear strain exceeds a certain value, i.e., the cyclic threshold shear strain. The consequences of exceeding the threshold are reflected as cyclic phenomena: settlement, pore water pressure buildup, stiffening, and degradation of strength.
In order to explore these phenomena, it is necessary to model the force transmission in sand depending on amplitude, where force chains play the key role as a force transmission mechanism. A force chain is the path through which compressive forces are transmitted in a system of the grains and voids. There are two networks of contact forces that complement each other and show a different mechanical behavior; a weak network that behaves like a fluid and a strong network that behaves like a skeleton (assumes shear stress). Consequently, force chains also play a role in determining the mechanical properties of the material, such as stability, elasticity, and flow.
The research objective included the issues of resistivity, stability, and configuration of the force chains. However, the issue can be solved using PFC3D in conjunction with laboratory tests (cyclic direct simple shear test using an NGI-DSS device).
Numerical Modeling of NGI-DSS Device and Sand
Numerical analysis included modeling of boundary conditions, generation of synthetic material, sample preparation, selection and calibration of the contact model, test simulation, and extracting and processing a series of collected data. A more detailed description of modeling, as well as generating and preparing the sample is given in (Pavlic et al., 2017).
NGI-DSS Device
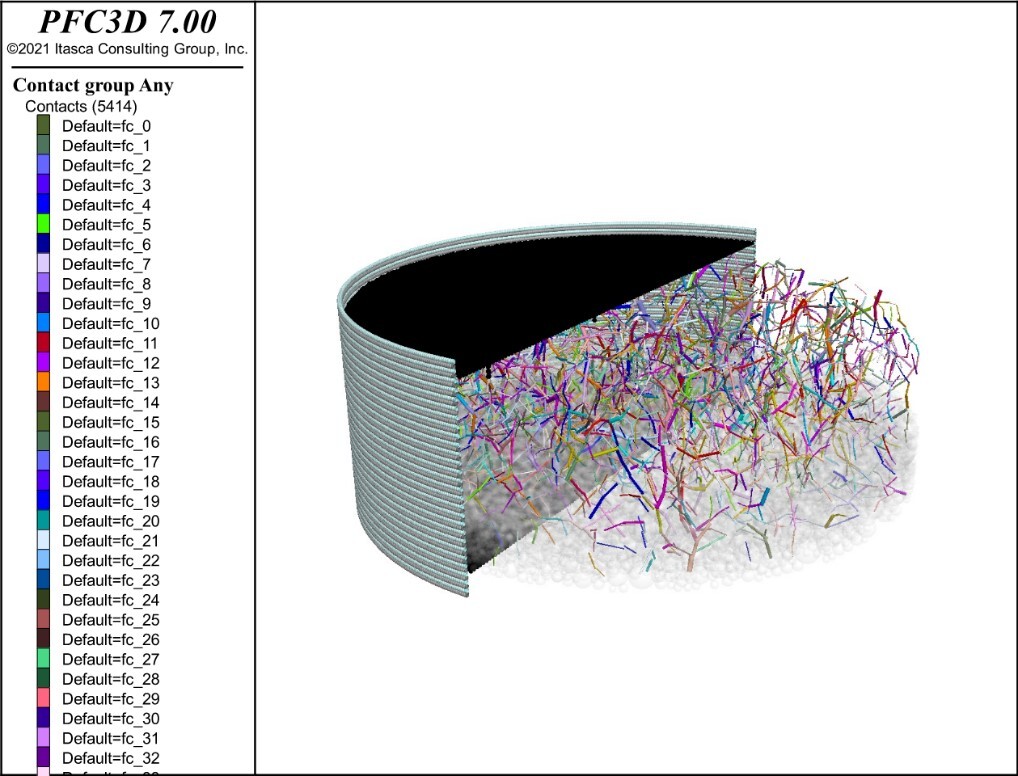
The elements of the NGI-DSS device that enclosed the sample was modeled (see Figure 1) and defined the boundary conditions. The caps and porous discs on the upper and bottom sides were modeled using clumps. The membrane was modeled as rigid horizontal rings (clumps), that are aligned vertically and linked using the linear parallel-bond contact model, which enables the transmission of momentum and tensile force between them.
Sand
Two types of sand were modeled and used for different purposes: (1) spheres with a regular arrangement of grains into columns and rows, and (2) clumps with a random arrangement of grains as well as irregular shapes. The objective of the sphere model was to compare it with the theoretical model, whereas the objective of the clump model was to study the impact of the grain shape on the effects of arching and grain interlocking.
Test simulation
The test consisted of two stages: (1) the sample was vertically loaded, and (2) the upper disk was maintained at a constant height and sheared at given cyclic sinusoidal strains, while the vertical boundaries of the membrane rotated for the value of the amplitude.
The concept equates the testing of a fully saturated sample under undrained conditions (constant volume) with a dry sample without water while maintaining a constant height (constant volume). Pore water pressure is in reality zero during the test, while the change in vertical stress (in order to maintain a constant height) is equal to the change in the pore water pressure that would develop in an actual undrained test.
Results
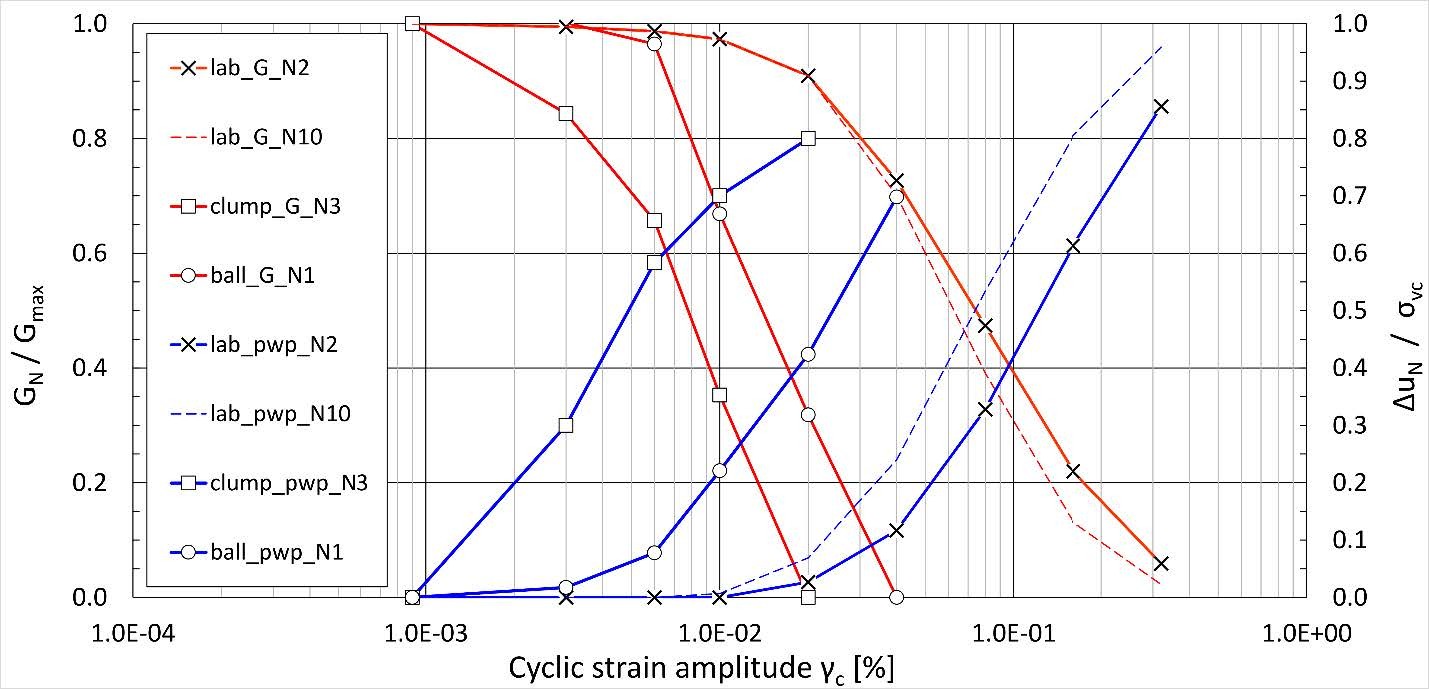
PFC3D allows each grain (displacement, velocity, rotation), grain series (direction and magnitude of the contact forces), and average values of stress and deformations at larger volumes to be monitored. Threshold, force chain stability, change of the shear modulus, and pore water pressure are explored by monitoring the number of contacts, porosity, and the stress-strain relationship depending on the amplitude.
Figure 2 shows the results of the uncalibrated sphere model (grains are magnified 15 times) and the results of the uncalibrated clump model (grains are magnified 7 times). In both models, it is possible to see a sudden change in mechanical behavior after the deformation threshold has been exceeded. In a later stage of the study, the parameters of the contact model will be calibrated based on laboratory tests.
Conclusion
- It is necessary to use different levels of observation in order to obtain a complete picture of the mechanical behavior.
- It is expected that the definition of principles on a microscopic level that corresponds to the response of the granular material on a macroscopic level (the numerical model makes that possible) should allow the following: determining the control mechanism of mechanical behavior of the sand before and after the threshold; determining the key factors affecting the threshold size; defining the role of the force chains; understanding dynamic phenomena, such as liquefaction, wave propagation, avalanche and earthquake; and explain the different values of the shear modulus obtained through dynamic and cyclic tests.
References
Pavlic, V., Matesic L. & Kvasnicka, P. (2017). “Numerical modelling of the NGI-DSS test and cyclic threshold shear strain for degradation in sand”. Granular Matter (19): 37